Aspect reports
The Aspects at a Glance report is a box plot report that is produced for the Student Survey only. Once a minimum of 15 Primary or Intermediate/Secondary student surveys have been completed for the same year, Aspect reports can be viewed as an overall picture (all aspects on one report – Aspects at a Glance report).
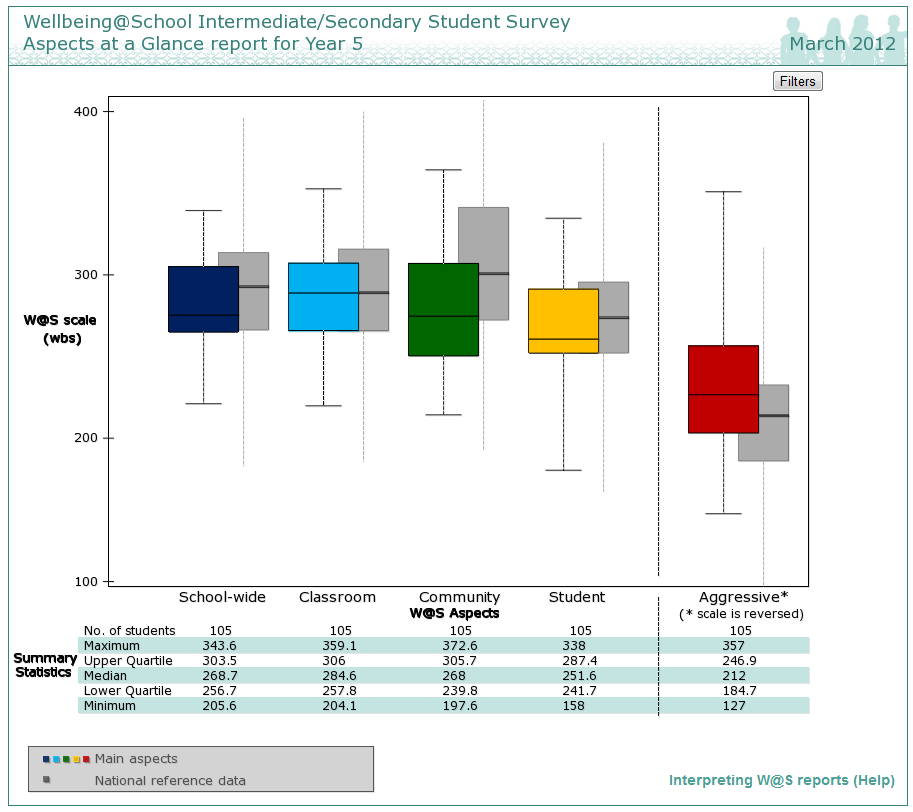
This report provides you with information about the extent to which students agree that each aspect and/or sub-aspect is reflected in school life. It enables you to explore overall patterns of response within your school as well as recognise similarities and differences amongst sub-groups. Where possible, the distribution of a national reference group of students of a comparable age is shown as a shadow box plot.
The Aspects at a Glance report uses the W@S scale developed as a part of the Wellbeing@School project. Box plots show distributions of students' scale scores in groupings chosen by the user. This report gives an overview of the extent to which students (collectively) agree that each W@S aspect is reflected in school life and can be used to identify aspects that you may want to further explore. It is generated for each year group and can be filtered by ethnicity and gender. (Note: Aspect reports per year group will only display if there is 10 or more completed surveys in that year group).
More information about the W@S scale and scale scores can be found in the W@S technical manual [pdf].
The Aspects at a Glance report need to be read in conjunction with the scale descriptions to get the most meaningful information from the data. The box plots are presented on measurement scales, each of which has an associated scale description showing typical student responses for different parts of the scale.
Interpreting the Aspect (box plot) reports
Learn more about Understanding and interpreting box plots >>
To make full use of the box plot reports you will need two sets of information: the Aspect report (box plot) for your student data and the scale descriptions for each main aspect.
The Aspects at a Glance report below shows the report for a fictitious school with the distributions of Year 7 student responses for all five aspects on the W@S scale. For this school we notice that the Prosocial student culture aspect has considerable overlap with the Aggressive student culture aspect. The latter aspect also has a very long upper tail, indicating some students may be experiencing aggressive behaviour on a fairly regular basis.
Before jumping to any conclusions we need to see what the scale descriptions can tell us. We observe that 25% of students have expressed views that place them between about 250 and 350 wbs units on the W@S scale.
The scale description for Aggressive student culture tells us that students located at about 250 wbs on the scale typically report being hit, pushed, hurt, threatened, force being used against them, and that being bullied is a common occurrence. Further up the scale these things become more frequent and additional typical experiences are described – For example, being hassled or put down because of learning or cultural differences, sexual insults and cyber bullying.
The scale description for the lower tail for the Pro-social student culture and strategies aspect is also worth looking at. Students in the lower tail (25% of all students) are scoring between about 150 wbs to 250 wbs on the W@S scale. The scale description for Pro-social student culture and strategies suggests that typically between 150 wbs and 200 wbs students feel a lack of support in difficult circumstances, observe a lack of respect between students and teachers, and lack the skills to “walk away” from contentious situations. From 200 wbs to 250 wbs, things look brighter, and typically students are a little more positive at this part of the scale.